Simply ranting: My PC has been behaving weirdly for the past 1-2 weeks since we upgraded the OS. The audio is not working at times, so I gotta switch my existing trading alerts over to my laptop. Then the taskbar keeps flicking. We thought we resolved it over the weekends. Last night, while setting up for trading, it showed even more signs of instability. Eventually, my hubby decided to re-format the PC, while I had to make do with just trading on the laptop for these few days.
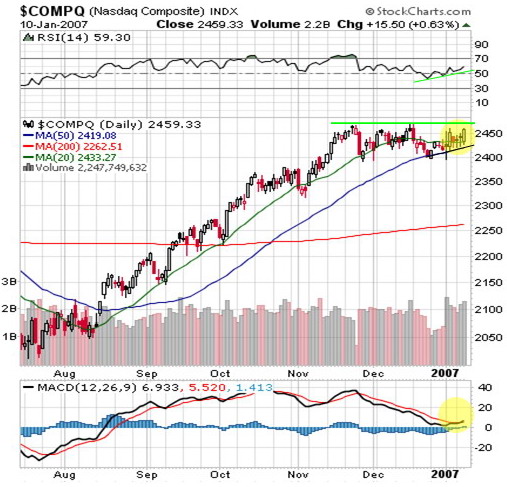
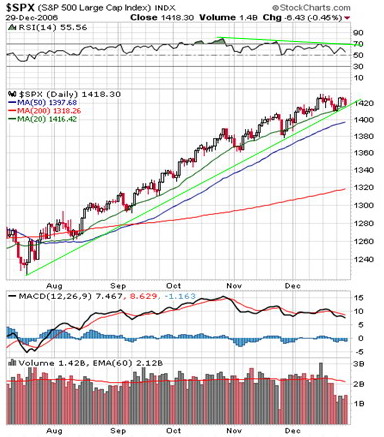
Dow and Nasdaq were marginally up and S&P slightly down in a choppy Monday. With FOMC policy statement up coming on Wed, traders are unwilling to put more money on the line unless there's some exceptional earnings results. This is a week with heavy dose of economic data and earnings, so sit tight!
Tue: Consumer Confidence
Notable earnings: CKFR*, AMLN, MMM, CFC, CYMI*, JNPR, LCC, SNDK, PG, MAN, SIRF*, ITW, WBSN, KYPH*, WYE, CME*, K
Wed: FOMC policy statement
Notable earnings: MO, GOOG*, SBUX, BA, EL, FORM*, LLY, GILD, SLAB*, OXPS, SUN, VRSN, WEBX, TWX, LLL, IR, PHM, SEPR*, EXP, HOLX*, AH*
Thurs: Personal Income, Personal Spending, ISM Index
Notable earnings: AMZN, ILMN*, VLO, ISRG*, MNST, RACK*, BSX, ERTS*, EOG, BUD, MYL, RGLD, YRCW, WCC*
Fri: Unemployement
Notable earnings: NYX, OSK*, THQI
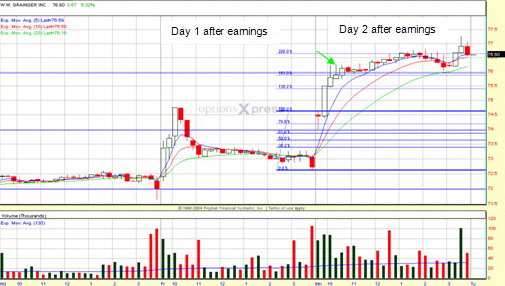
*Stocks that tend to have big moves after earnings
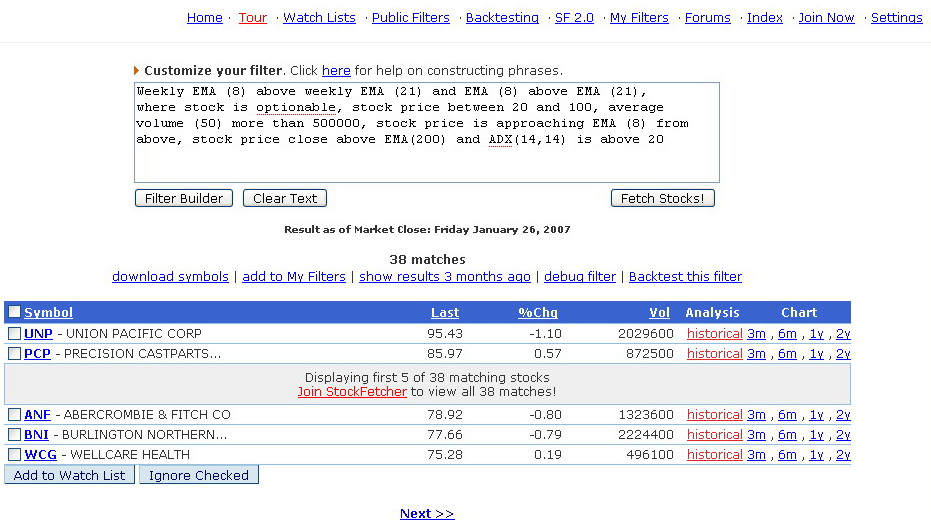
-Filtering Wallstreet shows you how to create a filter based on
Tweezer Bottom.
-A stock's move is made up of market movement (40%), sector (30%), and finally the fundamentals of the stock/company account about 30%. With that in mind, it is important that we trade with the
market trend.
-Nice
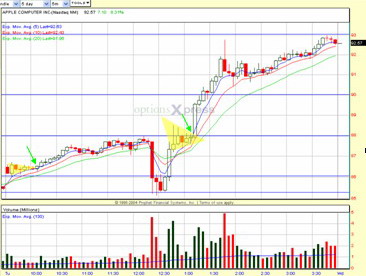
short squeeze play by Jamie
Lastly, be sure to check out MY DEL.ICIO.US at the left column for more good reads.