(function() { (function(){function b(g){this.t={};this.tick=function(h,m,f){var n=void 0!=f?f:(new Date).getTime();this.t[h]=[n,m];if(void 0==f)try{window.console.timeStamp("CSI/"+h)}catch(q){}};this.getStartTickTime=function(){return this.t.start[0]};this.tick("start",null,g)}var a;if(window.performance)var e=(a=window.performance.timing)&&a.responseStart;var p=0=c&&(window.jstiming.srt=e-c)}if(a){var d=window.jstiming.load; 0=c&&(d.tick("_wtsrt",void 0,c),d.tick("wtsrt_","_wtsrt",e),d.tick("tbsd_","wtsrt_"))}try{a=null,window.chrome&&window.chrome.csi&&(a=Math.floor(window.chrome.csi().pageT),d&&0=b&&window.jstiming.load.tick("aft")};var k=!1;function l(){k||(k=!0,window.jstiming.load.tick("firstScrollTime"))}window.addEventListener?window.addEventListener("scroll",l,!1):window.attachEvent("onscroll",l); })();

Friday, September 29, 2006

Review of LRCX Trade


It was a flop trade. Right after my entry, stock started to move against me. My stop-loss was @ 5.5 & that same day, it threatened to trigger it, coming as close as 5.6 bid-5.8ask. Bad feeling, but I thought since I've already set the stop loss, will just leave it to the market instead of getting my nerves all bunched up. That's what stop loss are for right, control your emotions.

The next day I woke out to find that LRCX has recovered some grounds & actually in profitable position. However, on Wed, it was moving sideways. Dismayed, I told myself I will give it another day because I usually exit my position by 3rd trading day if there is no progress.

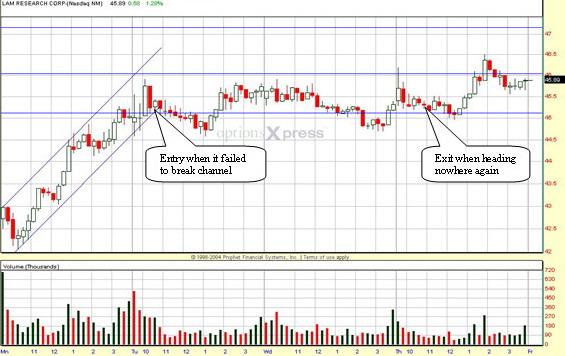
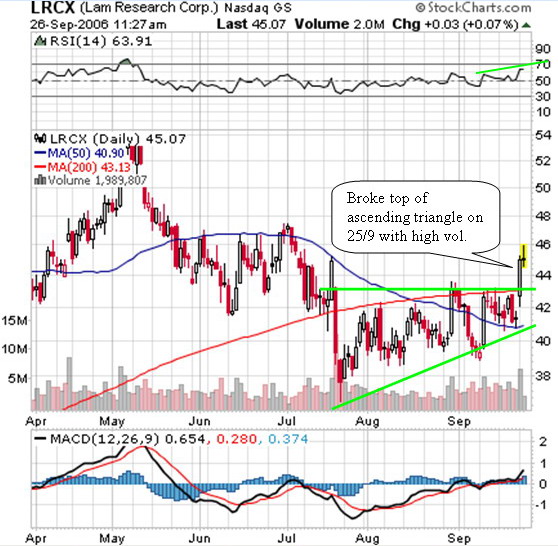
On Thurs, it opened with a bang & even broke the minor resistance @ $46. I could have closed it for some profits. Didnt. Usually don't like to initiate or close my position minutes after market open. Option prices & its volatility are jumping around. As the market settled down, LRCX was again moving directionlessly, together with the choppy SOX & overall market. Didn't like what I saw & exited for 0.1 loss.
The stock managed to pick up around noon & even climbed as high as $46.51, but by then I was long gone...

Postmortem verdict: I had my chances to closed it at a profit. A pity I didn't. Slight pity was all I felt, because what's more important was I had my emotions under control in this trade.

Dow Direction From Now To Year End


Poll conducted by Yahoo Finance shows that 64% (as of today) of respondents are bullish on the DOW. There's no doubt that Nov-Dec are rallying months, but I do think its not going to be a straight line up from now. Be ready for some serious pullback soon...

Thursday, September 28, 2006

Market Looks Tired

The attention was all on DOW yesterday with everyone watching to see if it can close at 10 yr high. An attempt that was close but failed. The window dressing by fund managers came earlier than I thought, with the major indices hitting multi-year high recently. But momentum appears to be slowing down. Call me a pessimist, but I see a bear lurking at the corner. Let's see how far the funds managers can push it before the bears take over. Watch tight as it can happen anytime from now

Biotech sector was the big winner yesterday, with the sector breaking out of ascending triangle on high volume.

AMGN's Vectibix drug was approved for colon cancer yesterday just before market closed. Stock closed @72.14. From Briefing.com "...We also note that back on Sep 14, Citigroup said they expected AMGN to react +5% to +10% with a full approval..." If the Citigroup analysts were right, then we can expect AMGN to hit abt $74 conservatively (1.05*71), which is right at about the 6 month high. Keep it in your radar for today.

Interview With Martin Pring

Check out a 2 part interview conducted by Cybertrader with Marting Pring, an expert on technical analysis. Good interview.

Part 1: His thoughts on how active traders can improve their trading outcomes in today's volatile markets.

Part 2: He discusses strategies on various price patterns, including rectangles, head and shoulders, and his favorite setup: one- and two-bar price patterns.

Blogger Problem

Been encountering some problems with blogger these 2 days, not sure what's wrong though...

I went in LRCX with Oct 40 Call on Tue, still hanging in there with the stock almost flat today, & as I'm writing, in a slight loss position. I'll give it another day to run. Will keep you updated on how it turns out, win, lose or draw.

BRCM broke out of resistance today & climbed $1, though it appears to have retreated near 38% Fibonacci @ 31.45. Didn't enter this trade as I'm already in LRCX (same sector, both in semis)

Wednesday, September 27, 2006

My Trading Style (Part 2)

Part 1

As I have said before, I like to keep my trading simple (hence I named after this blog Simply Options Trading!). I buy call options and put options. I don't participate in strategies like spreads, combination spreads (butterfly, iron condor etc)or synthetic positions. Occasionally, I buy straddles, & very rarely strangles. Early on in my trading, I've tried my hand in trading spreads. Though with some success, I realised its not my cup of tea. While spreads are deemed to be more conservative approach (limited risk, limited gains), I guess I don't have the patience to wait a month for it to expire worthless to know that the money is safely in my pocket. But I don't entirely rule out revisting spreads in future though. For a start, I strongly encourage newbies to paper trade different strategies to see which suits them best.

I do swing trades & intraday trades. I don't like to hold my positions for more than a week & over the weekends because I want to minimize my exposure in this increasingly volatile world.

Most of the time I buy in-the-money options to reduce time decay effect & for greater price movement of the option. And I go with current month options, unless they are close to expiration, then I'll go to the next month.

To be continued...

Tuesday, September 26, 2006

Stocks On Radar 26/9

Watch for BRCM & LRCX on breakout to the upside today

LRCX forming ascending triangle. Note however that it is close to 50% Fibonacci @ 45.2. If can open above 45.2 & sustain momentum, along with market sentiment today, target 47.15

For BRCM, look to higher high for confirmation.

(The chart came late, had problems uploading to blogger)

Watching From The Sideline


I was just like that guy there watching the market from the sideline yesterday. Market gapped up on opening, but faded that gap quickly. However, by 11am ET, the entire broad market started to rally. Not an easy day for trading, so I opt out. Tough luck for ugly chart though. But as he says, you win some, you lose some.

Had 2 stocks my watchlist (SNDK, MGM), but they didn't pan out. SNDK gapped down & has moved too close to my target, so didn't want to chase it. MGM's risk-reward ratio was not favourable.

I was glad I didn't force myself to take these 2 trades, because they wouldn't have worked out. One of the sins in trading is OVERTRADING. Its the quality, not quantity of trades that count. Always remember Warren Buffet's rule of capital preservation. It is better not to make money than to lose money. I must admit that when I first started trading, I felt compelled to enter new positions everyday. I felt like I HAD to trade, and that if I didn't have new trades for the day, I'm not working. But through some lessons learnt in the market (of course I paid a price for that!) and through more readings, I've learnt to managed my trigger-eager emotion better. When you feel that the conditions are not right, just let it pass. Better opportunities will come by...

New Rule On Automatic Exercise Of Options!

I just read from Adam's posting that a new rule on exercising options will come into play from Oct expiration onwards.

Options that are even slightly in the money (by a nickel) will be automatically exercised, as compared to the current threshold of 25 cents in the money. But you have a choice: If you don't want it to be exercised, you can instruct your broker not to do so, but it must be conveyed by the Friday afternoon before the monthly options expire.

Just passing this info along...so do watch out in the coming Expiration day

Monday, September 25, 2006

Review of JOYG Trade


I closed the JOYG trade on Fri. As part of my trading style, I like to close my positions before the weekend. As you know, the stock market is increasingly volatile compared to 10 yrs ago, with geo-political issues, terrorism, oil concerns etc, anything can happen over the weekends & I like to minimise my exposure. The last thing I want to see is a profitable position turned loser due to some gapping action which even with a stop order attached, will sustain big losses. Remember, options, unlike stocks, have time decay. Your holding power is limited.

JOYG seems to be consolidating in a range of 33-33.5. Sensing that it was heading no where, I closed my position before mid day. May consider entering again if it breaks out of the tight range. We'll see.

Nasdaq Technicals Telling A Story?


Am abit late this week in looking at the week ahead. Anyway, let's see what this new week is likely to shape up to be...

The Nasdaq, which closed last Fri below the 200MA is signalling a bearish story, albeit on a lower volume ahead of Rosh Hashanah Holiday. Look for it to test support @ 2200. Overall, I'm still leaning to the bearish camp early part of this week as the major indices were over extended prior to the sell-off last Thurs & the Nasdaq looking weak. But we may see a turn at the end of the week as we approach end of Q3, with some possible window dressing.

The coming week is filled with lots of economic data, especially important & can turn the tide is Consumer Confidence on 26/9 and Personal Income & Spending on 29/9. There are also some housing data on 25/9 & 27/9.

On the earnings front, watch for RIMM (28/9).

Sunday, September 24, 2006

My Trading Style (Part 1)

Someone once asked me if trading options is easier than trading stocks. And my answer is a big NO, even though I have not had much experience trading stocks. Therefore, I like to keep my trading style simple or as some say the 'KISS' way (Keep It Simple & Stupid. Options itself is already a complex instrument, so why make it even more complicated?

Before I go on, I'll like to explain why I feel that options trading is tougher than stock trading:

-Direction: Ok, this is the only element which both stock trading & options trading need to get it right to make money. And the similarity ends here.

-Timing: Options have the element of time decay, which means that as time passes, the value of options will fall assuming all things constant. Thus its useless if you, as a buyer, gets the direction right but the timing wrong in options trading. Assume the stock price moves in a sideways manner after your purchase and the expected move only occurs 6 months later. Your option which say has a 3 month maturity will expire worthless. But for stocks, you can hold the position for as long as you like for your expected move (though there is opportunity cost involved or interest incurred if purchase was made on borrowed money). In options trading, you are fighting against time.

-Magnitude: In stock trading, as long as the stock price goes in your direction, you'll make money, even if the move is only 10 cents. In options trading, if stock price goes in your direction, but the move is not large enough to cover time decay, you are still on the losing end as a buyer.

You are out of the game if you don't get these 3 elements right. And as a matter of fact, you WILL find yourself out of the game fairly often, which is why money management is extremely important if you are in this for the long run. I'll talk more about this later on.

Well, since options trading is more difficult, why do you choose it you may ask. For the following reasons:

--Limited dollar risk and exposure: As an options buyer, one can control the stock for just a fraction of the cost of buying that stock. Also, one can never lose more than his purchase price of the option. I must say this attracted me to options trading in terms of feasibility, because I don't have a deep pocket to start with.

--Leverage: Options trading can provide larger % gains. A $5 move in a $50 stock represents a 10% profit, but if you have participated in terms of options, the % gain would be phenomenal, much much higher than 10%!

--Versatility: One can profit whether in Bull or Bear markets. You can make money in a bear market by purchasing put options, which increases in value as stock price declines. And in a bull market, call options behaves pretty much like stocks, except with more leverage. This is the beauty of options.

To be continued...

Review of CAT Trade


Just like to share with you the Caterpillar (CAT) trade which I highlighted previously.

Was watching this stock closely on Fri & entered Oct 67.5 Put for this trade when it broke previous day low. As you can see, the breakdown is also accompanied by high volume. Aided by the bearish tone of the overall market, it continued its slide down nicely to close to 62, which I had also earlier pointed out as a potential support area. And thereafter bounced off with a hammer-like candle, indicating a reversal to the upside. I exited soon after. For the rest of the day, the stock was just drifting between 62.5 & 63.

Although this stock has the potential for further move downwards, I had intended this trade to be intraday as I don't like the idea of holding it over the weekends

Friday, September 22, 2006

Trading on FOMC day?

Ok, the FOMC meeting is finally over & true to what I said in my earlier post, it had turned out to be a non-event as market has already priced in the decision of keeping it @ 5.25%

I'm not sure if I mentioned before that I sit out on FOMC meeting days. Stock market prior to the meeting is usually range bound & most traders (incl myself) wish that such meetings could be held at the the start of the week or at least before market open. FOMC announcement on Wed @ 2.15pm ET means that its hard to trade on Mon-Wed morning. And I avoid trading AFTER the announcement as well as I noticed there tends to be head fakes & I don't want to be caught in a whipsaw position. I'll rather wait for the dust to settle & start looking for opportunities the following day.

Having said that, I came across at a short trading video by Hubert on Trader Mike's site on trading the FOMC day. Interesting stuff. Go take a look, but I'm not saying it suits everyone.....

Stock Watch 22/9 - Breakdown


Caterpillar (CAT) setup looks almost the same as JOYG which btw was shaping up (or rather down) nicely yesterday. Still holding JOYG. Ok back to CAT. It has broken the base (64.46)of the descending triangle yesterday on high volume. Also closed below 50% Fibonacci Retracement. Support areas to watch out: 63,62,60.75

Thursday, September 21, 2006

Stock Watch for 21/9 - Breakdown


JOYG chart looks bearish as it closed below 6 mth low of 35.07 & also below 78% Fibonacci Retracement. Keep in on your radar for PUT options. Target exit at 32 (early Oct'04 gap)

OIH looks set to head lower as it broke the support @125 after trading in a range of 124-130 in the past week. 120 is the psychological mark as well as being close to 78% Fibonacci Retracement @ 119.3.

Wednesday, September 20, 2006

Internet Space Took A Dive


Right after 11.30 ET, when Yahoo!(YHOO) warned that it is seeing slowing/weakness growth in Auto & Financial services advertising & that results are expected to be at the lower end of prior guidance , its stock took a dive from $29 before finding support at $25 (near Mid July low), all within less than 1/2 hr.

And dragging down with it GOOGLE (GOOG) as well. GOOG fell like a rock, down almost $20 before finding support near $392 (the gap between 12/9-13/9). With several analysts out defending GOOG after this sell-off, it managed to gain some ground & close @$403.8

The YHOO news together with the political unrest in Thailand shook the overall stock market, on a day when range bound trading is expected ahead of FOMC meeting. Well, the stock market is unpredictable....

New Stock Chart in Yahoo Finance


My Chief Support Officer pointed out to me that Yahoo Finance has come up with new stock chart. Impressive. It comes with Technical Indicators such as RSI, MACD, Stochastic, Moving Averages, Bollinger Bands etc as well as your choice of Chart Setting. There is also the comparison feature. Google Finance charts pale in comparison though it has explanatory notes beside the chart which Yahoo Finance charts don't have.

For those of you who wants an alternative to real time quotes, Yahoo Finance is now offering this service, at a price of course. There is however a 30 day free trial.

Competition is always good for the consumer I say. Keep it up!

Monday, September 18, 2006

Recommended Blogs

While I was doing research recently to set up our blog, I came across a handful of other blogs on trading which are pretty impressive and they are on my blogroll. And here goes the list: (in no particular order or whatsoever)

-The Bull Trader
Setup by 4 dynamic undergraduates from UCLA & UC Berkeley. They started off on blogspot before moving on to their own domain. I like their technical analysis section. (Gosh, wish I had started off earlier like them. Oh well, better late than never. One thing for sure: When I have kids, I'm going to get them started early on money & sense)

-Daily Options Report
Adam is a professional options trader & has been trading for 18 years! He has also written for StreetInsight.com penning the Options Column. He is into long gamma strategies. Some of his blog entries are quite entertaining as well.

-The Kirk Report
Named one of the "must-read bloggers' in the October 06 issue of Kiplinger. Other Alccolades includes being named Barron's favorite financial blog both in October & November of 2004.

-Trader Mike
Oh my, this is THE most extensive blog on trading that I've come across to date. Very rich in content, highly comprehensive.

-OneOption
Another site that focus on options (other than Daily Options Report), I like his Q&A section. Detailed replies to your questions.

Sunday, September 17, 2006

Key Highlight Next Week

With tame reading of the CPI data last Fri coming in line with consensus, the market closed on a positive note as it lends further support that Fed may keep rates on hold @ 5.25%

Key Highlight of next week is FOMC policy meeting on Wed. Expect sideway movement ahead of this meeting. As of 15/9 market close, Fed funds futures showed only a 10% chance that rate will move to 5.5%. But with major market indices over extended, & the market expectation built in that Fed likely to forgo rate hike, FOMC on Wed may turn out to be non-event if there are no NEW news. If this happens, market pullback is highly likely.

Key earnings next week includes:
ORCL-19/9 AMC
CC-20/9 BMO
FDX-21/9
NKE-21/9 AMC

Friday, September 15, 2006

Mr Bernanke Is In Town


Just like to revisit this spoof of Fed Chairman Mr Bernanke as he is in town (yes, Singapore! :))for the IMF meeting. Can't help but love this video, gotta hand it to these creative students of CBS (Columbia Business School, not the TV channel)

Tough road ahead for the Fed Chairman with the Stagflation problem....

Stuck In The Mud


The overall market was just like this truck, stuck in the mud, moving sideways throughout the whole day. The Bulls are taking a break after 4 straight days of wins. Traders also do not want to have any huge positions ahead of the closely watched CPI data on Fri. If the CPI data leans to the hawkish camp, watch for play to the downside.

Thursday, September 14, 2006

Volatility Game


With the Quadruple Witching this Friday, volatility is the name of the game. I'm starting to see some familar patterns on the volatility chart, do you?

Wednesday, September 13, 2006

Plan Your Trade, Trade Your Plan

As the saying goes "Plan your trade, trade your plan". I had a trading plan before I entered OEX call yesterday. My target index exit price was 604. The market was bullish & in my favour. Good. But I did not follow my trading plan. I exited before my target was hit. And the next thing I know, the OEX went on to hit 604 and as high as 606.8!

Although I should be happy that it was a profitable trade, I was not. Because I did not follow my initial trading plan. *Ouch*. Fellow traders would have understood what I mean.

This episode reminded me of an article "Steal Warren Buffet's Stock Market Lesson Plans?" by David Jenyns. I have also posted it here under "Articles" to share with all.

Remember, Mind over Methods. Always.

Apple Computer New Launches


Apple Computer confirmed the introduction of a new Ipod, Shuffle and Nano during its special media event. It is also planning to release wireless video box for TV coming Q1 2007.

While its new products are exciting, its stock price movement during the special event was not. *Yawn*.Its very unlike the previous few launches. Perhaps it has already been factored in, perhaps you gotta wait for a few days for analysts upgrades (if any).

Right now, the stock price is stuck in a tight range of $71.5-$73.5.

Broad Based Rally

It was a broad based rally with the homebuilding(+7.7), brokers/dealers(+6.7) & retail(+14)sectors advancing strongly. Continued declining oil prices coupled with some upbeat earnings from Goldman Sachs (GS)and Best Buy (BBY) boosted the stock market.

Goldman Sachs, which announced a solid Q3 report + 60mil share buyback, rocketed its stock by almost $9 to a high of nearly $160. Watch out for Lehman Brothers(LEH) & Bear Stearns(BSC), which are announcing earnings on Wed & Thurs respectively.

BBY was simply amazing. The stock gap down $1, before climbing another $6!!!

Tuesday, September 12, 2006

Energy Sector Sell-Off


There's only 1 word to describe the energy sector yesterday. UGLY. Period.

OIH opened below support of 130 and as I said in my earlier post, if this strong support is not able to hold, there will be a free fall. Although it attempted to recover during lunch hour, it was pretty much fruitless as it continued to slide further & wrap up the day on high volume, closing @ 125.8.

With the full candle outside of lower Bollinger Band, I'm waiting for a chance to get in for the move up.

Mixed Day on 9/11


On the 5th anniversary of 9/11, the stock market started off with an aggressive sell-off. Biggest losers of the day were the commodities sector.

However, by abt 11.00am ET, the broader market started to recover and the 3 major indices (S&P 500, Nasdaq and Dow Jones)managed to close in the positive territory, with support from Retail and Housing sectors.

What a day....

Monday, September 11, 2006

Apple Cell Phone?


AppleInsider reported on 8 Sep that a recent Apple Computer patent filing for a multi-functional handheld device is proof that the company has greater ambitions such as a smart cell phone, one Wall Street Analyst says.

Saturday, September 09, 2006

Exciting week ahead

Looking forward to next week, with many key events / economic stats coming in:

Mon: OPEC meeting starts
Tue: APPLE special event
Wed: Treasury budget
Thurs: Aug Retail sales stats
Fri: CPI

Next Fri is also Options EXPIRATION day!! Highly volatile day, but also presents great opportunities :)

Have a great week ahead!

Market Recap


Though Fri ended with modest rebound, it is still on weaker volume.

OIH closed @ 131.45, outside of the Bollinger Bands. See chart. Oversold. Wow! Did anyone enter long on OIH before market close? With support at 130, i like the risk/reward ratio. If 130 support is not able to hold next week, further slide expected. (Note OPEC meeting starts next Mon)

AAPL had another pullback after sprinting ahead on Thurs. Normal. Stock now resting at 75.52. Stock needs to push thru 6 mth high of 73.38

Friday, September 08, 2006

Gains not convincing

Although the market opened modestly higher to recover some losses from the past 2 days selloff, there is chance it may close negative today as gains so far have been limited in scope. Next Mon is 9/11, could there be some nervousness in the market ahead of weekends or on next Mon? Let's see how it shapes up. And oh yes, OPEC officially meets next Mon too.

Apple Computer - Its Show Time!


AAPL broke the ascending triangle (formed in Aug) with high vol. on 5 Sep after confirming special media event on 12 Sep to introduce new products and services. It has powered on, except with a pullback on 6 Sep

It has closed above 62% Fib Retracement yesterday @ 72.8. Next target wld be 78.6 which coincidentally also the 78.6% Fib Retracement!.

Area shaded in chart are prelude to AAPL's previous media events to launch new stuff. Such events are movers....believe this guy still has the leg power to potentially hit 80