


Free Tool: Options Probability Calculator
After reading 101 Options Trading Secrets and The Option Trader's Guide to Probability, Volatility and Timing, I've come to learn about the use of options probability calculation. So I went in search of free options probability calculator available online. Most of the trading tools that I use are free of charge, as I believe that fixed cost for trading should be kept to minimal. So here's a few places where you can find a free options probability calculator:
OptionsToolbox
Peter Hoadley Options Tool
Tradersoft :This one has to be downloaded and can only be used for limited period after which you have to register. The good thing is since it is installed in PC, can be used offline.
OptionVeResearch: This is the one I'm currently using for its ease of use and simplicity.
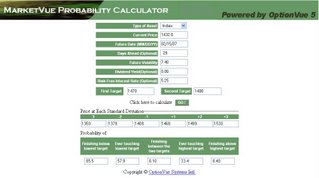
Here's how you can use it. For example you are bearish and want to do a Feb 07 bear call spread on SPX, say sell 1470, buy 1480. By keying in the necessary info, you can see that the probability of your sold leg being safe at expiration is 85.5%. We can also tell that for SPX to stay within one standard deviation boundary, it has to be contained between 1408-1468.
posted by Simply Options Trader at 8:03 PM PERMALINK
![]()
![]()
2 Comments:
G'day champ,
Just wanted to pass on a bit of info about how those probability figures are arrived at, as I understand it.
Have you ever wondered why there is "85% probability" that the stock will be one side of a particular price point at a certain day?
First of all, the model assumes completely random direction every day from now until then.
And it uses the current Historical Volatility of the stock.
So if the stock has just had a big earnings jump and HV is high, then that tool will show you probabilities for very large distances.
If the stock has been very quiet lately and HV is low, the tool will be showing you a high probability that the stock won't move far.
However, if there is an upcoming news event like earnings, the stock actually will jump quite a lot, making the tool quite inaccurate.
Guess it helps to know how to take these things with a little salt ... being aware of how the stock's current Historical Volatility value compares to its likely future volatility will help you know if the tool is over or underestimating the future volatility of the stock.
Does that make sense?
I'll re-word in case it doesn't.
If the stock has been very quiet lately, and it's volatility could increase, perhaps due to news, the tool will be UNDERESTIMATING the distance the stock will move.
If the stock has just been jumping around, perhaps due to news events, and it can be expected to quieten down from here, the tool will be OVERESTIMATING the distance the stock will move.
The tool is unable to understand and predict the natural cycle of a stock's volatility changing with time.
Cheers / Ben
Hey Ben,
Well said. Yes, as with any model, assumptions go behind it and volatility always plays an important role in options pricing or modelling.
Thanks for bringing this out and I'll be making a full post about this to explain more.
Post a Comment
<< Home