My MA Got Away

This is a really high probability setup (with many technical indicators aligned) which I missed because I was too stingy and maybe also alittle fearful.
Why is this a high probability set-up?
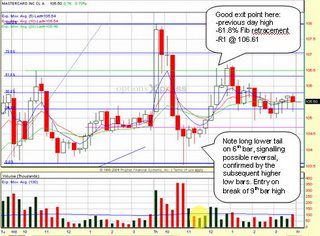
-6th bar on 15 min chart showed a somewhat bullish candle with long lower tail (would be ideal if it didn't close in the red), signalling possible reversal
-The low of 6th bar coincides with low of previous day
-Bars 7th-9th showed higher low, confirming the reversal. The consolidation was also on low volume
Entry Point and Why
-Break of 9th bar high
-The pink line on the chart shows a minor support level which turned resistance area today
-It is also the pivot point @ 104.8
So what happened?
I mentioned before that MA is on my watchlist. But I only saw this great setup at the 10th bar. Bid-ask was 5.7/5.9. I put in an order for Jan 100 Call @ 5.8, trying to get a better price (ya right, a better price and forgoing the profits??!!). The bid kept moving up and I didn't chase. I didn't chase because I was already 1 bar late into entry. I was processing in my head whether to chase or not, chase or not, and in my head I was thinking about $0.5 late (1 bar difference) is equivalent to about $0.3-$0.4 in option price as delta was about 0.8....that's alittle too much to play catch up. And as you can see from the chart, I missed the nice pop up, duh....
Where is a good exit?
I would have exited all if not some at the 12th bar because its near:
-Previous day high
-61.8% Fib retracement
-R1 (from pivot point calculation) @ 106.61
At this point, the call options that I had wanted to buy would have given me $1.0 profit per contract in a matter of last than one hour. What to say? Better luck next time, or maybe I should chase the stock if it is a really high probability one like this one.


2 Comments:
That's one of the reasons Bill O'Neil of IBD only uses market orders.
Yup, market orders for momo stocks especially
Post a Comment
<< Home