


New Stock Chart in Yahoo Finance

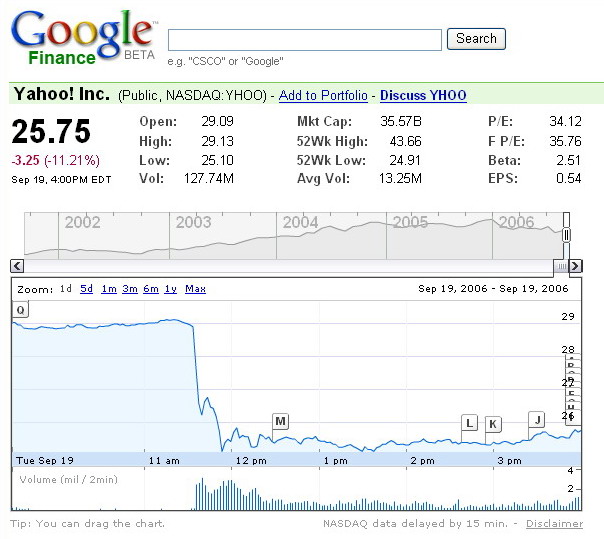
My Chief Support Officer pointed out to me that Yahoo Finance has come up with new stock chart. Impressive. It comes with Technical Indicators such as RSI, MACD, Stochastic, Moving Averages, Bollinger Bands etc as well as your choice of Chart Setting. There is also the comparison feature. Google Finance charts pale in comparison though it has explanatory notes beside the chart which Yahoo Finance charts don't have.
For those of you who wants an alternative to real time quotes, Yahoo Finance is now offering this service, at a price of course. There is however a 30 day free trial.
Competition is always good for the consumer I say. Keep it up!
posted by Simply Options Trader at 1:56 AM PERMALINK
![]()
![]()
0 Comments:
Post a Comment
<< Home