


Anatomy of AAPL, BBY
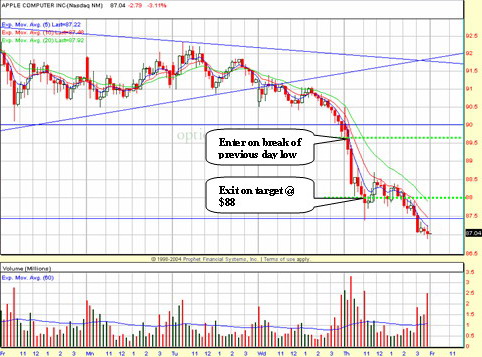
AAPL was in my watchlist. As I mentioned, it was trading in an increasingly narrow range accompanied by lower than average volume. And it closed below support @ $90 the day before. I was watching it on the 15 min and 5 min charts. AAPL opened up, but looking at the 5 min chart, it soon became clear that it was testing the $90 level. Entry on break of previous day low, with target @ $88 (20 EMA). Stock was well-behaved and exit on target. Stock rebounded for awhile but continued its slide downhill to close at $87.04, nearly closing the gap between 20-21 Nov. Cal Trader had some sweet apples as well.


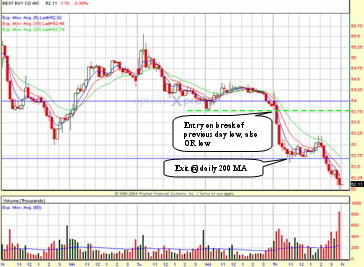
BBY also in my watchlist as NR7. On daily chart, $54 is a support level. Entry on break of previous day low, which is also the OR low. This sort of setup seems to have high probability of success, as observed by Richard. Target @ daily 200 MA at about $52.7, which was easily reached by BBY around 11.00am ET


BBY also in my watchlist as NR7. On daily chart, $54 is a support level. Entry on break of previous day low, which is also the OR low. This sort of setup seems to have high probability of success, as observed by Richard. Target @ daily 200 MA at about $52.7, which was easily reached by BBY around 11.00am ET
posted by Simply Options Trader at 11:14 AM PERMALINK
![]()
![]()
2 Comments:
SimplyOptions,
Good Stuff and congrats on both wins !
Thanks guys!
Post a Comment
<< Home