


Chart Study - RYL, BIDU
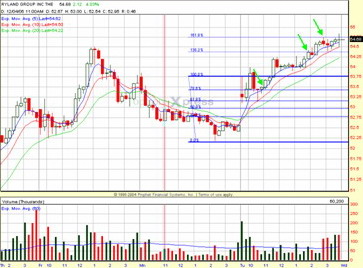
RYL gapped up and 1st bar closed in the lower half. 5th bar came close to OR low, printed a lower shadow, and ended up closing above 78.6 Fib level. 6th bar is a textbook hammer, narrow range and supported by 5 MA as well as 78.6 Fib level. Potential entry above 6th bar high with initial stop below 6th bar low. As this entry is below OR high, watch tight as it climbs towards OR high for potential stalling/reversal. Stock break through OR high with ease and after some consolidation, hit the 1.38 Fib ext. Exit and closed remaining position which it hit 1.62 Fib ext
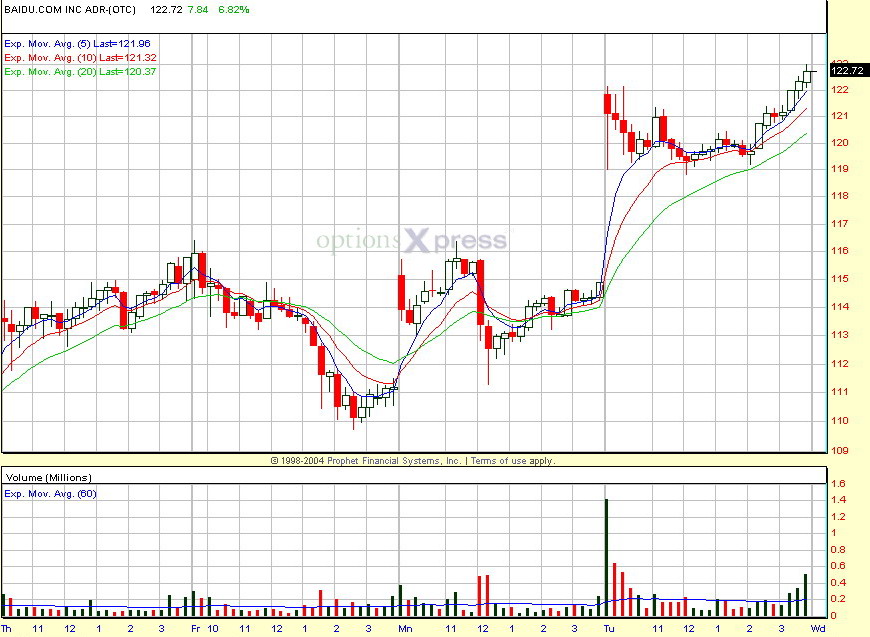
I almost wanted to enter BIDU last nite. It gapped up and drew closer to 5 EMA. Noticed how the volume started declining along the way. I had wanted to enter on 6th bar high, supported by rising 5 EMA. Target OR high.I was looking to buy the 115 Dec Call (delta @ 0.71) as it was trading at just slightly over $120. But just like the PSS example, the spread is too wide here. My IB screen was showing 7.7-8.0 for the option. As I was mulling over this wide spread, the stock moved up by a $1. I thought, not another PSS again! I checked the option price to see how much I "could have gain" if I had entered. And to my surprise, I saw on my screen the bid/ask 7.7-8.4!!! After sometime did it settle down to a more respectable 8.2-8.4. However, the next few candles would have triggered my my stop loss. I would have exited this with a scratch or with loss. BIDU then went on to make a U-turn later in the day. If you look at BIDU intraday chart, it has the U setup coined by Trader-X.
posted by Simply Options Trader at 2:22 PM PERMALINK
![]()
![]()
0 Comments:
Post a Comment
<< Home