


Chart Study - CMI
I've been reading & studying the NRB (narrow range bar) trading aka "dummy" style day trading from several master trader bloggers like Trader-X, Trader Mike, Wall St Warrior, Mercado de Estocástica.
This is an interesting day trading strategy. I'm still learning & hope to be confident enough soon to apply to real trading.
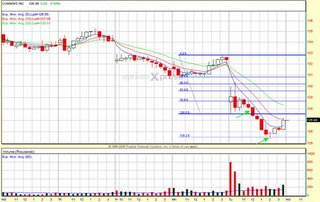
Below is a 30min chart of CMI, which announced earnings BMO yesterday & gapped down. Noticed how the 3rd-5th bar got narrower in range (consolidation) and moved closer to the 5EMA before the explosive move downwards. No visible support down till 125 on daily chart. Entry on 6th bar. 2 approaches: If you are more agressive, you could have entered below the low of 5th bar; or you could have waited for clearance of OR (opening range) low. Exit at 1.38 Fib ext. See how the stock rebound from 1.38 Fib ext? Fibonacci is simply magical!
This is an interesting day trading strategy. I'm still learning & hope to be confident enough soon to apply to real trading.
Below is a 30min chart of CMI, which announced earnings BMO yesterday & gapped down. Noticed how the 3rd-5th bar got narrower in range (consolidation) and moved closer to the 5EMA before the explosive move downwards. No visible support down till 125 on daily chart. Entry on 6th bar. 2 approaches: If you are more agressive, you could have entered below the low of 5th bar; or you could have waited for clearance of OR (opening range) low. Exit at 1.38 Fib ext. See how the stock rebound from 1.38 Fib ext? Fibonacci is simply magical!

posted by Simply Options Trader at 5:23 PM PERMALINK
![]()
![]()
0 Comments:
Post a Comment
<< Home